

This is an expanded version of my talk at NginxConf 2017 on September 6, 2017. As an SRE on the Dropbox Traffic Team, I’m responsible for our Edge network: its reliability, performance, and efficiency. The Dropbox edge network is an nginx-based proxy tier designed to handle both latency-sensitive metadata transactions and high-throughput data transfers. In a system that is handling tens of gigabits per second while simultaneously processing tens of thousands latency-sensitive transactions, there are efficiency/performance optimizations throughout the proxy stack, from drivers and interrupts, through TCP/IP and kernel, to library, and application level tunings.
Disclaimer
In this post we’ll be discussing lots of ways to tune web servers and proxies. Please do not cargo-cult them. For the sake of the scientific method, apply them one-by-one, measure their effect, and decide whether they are indeed useful in your environment.
This is not a Linux performance post, even though I will make lots of references to bcc tools, eBPF, and perf, this is by no means the comprehensive guide to using performance profiling tools. If you want to learn more about them you may want to read through Brendan Gregg’s blog.
This is not a browser-performance post either. I’ll be touching client-side performance when I cover latency-related optimizations, but only briefly. If you want to know more, you should read High Performance Browser Networking by Ilya Grigorik.
And, this is also not the TLS best practices compilation. Though I’ll be mentioning TLS libraries and their settings a bunch of times, you and your security team, should evaluate the performance and security implications of each of them. You can use Qualys SSL Test, to verify your endpoint against the current set of best practices, and if you want to know more about TLS in general, consider subscribing to Feisty Duck Bulletproof TLS Newsletter.
Structure of the post
We are going to discuss efficiency/performance optimizations of different layers of the system. Starting from the lowest levels like hardware and drivers: these tunings can be applied to pretty much any high-load server. Then we’ll move to linux kernel and its TCP/IP stack: these are the knobs you want to try on any of your TCP-heavy boxes. Finally we’ll discuss library and application-level tunings, which are mostly applicable to web servers in general and nginx specifically.
For each potential area of optimization I’ll try to give some background on latency/throughput tradeoffs (if any), monitoring guidelines, and, finally, suggest tunings for different workloads.
Hardware
CPU
For good asymmetric RSA/EC performance you are looking for processors with at least AVX2 (avx2 in /proc/cpuinfo) support and preferably for ones with large integer arithmetic capable hardware (bmi and adx). For the symmetric cases you should look for AES-NI for AES ciphers and AVX512 for ChaCha+Poly. Intel has a performance comparison of different hardware generations with OpenSSL 1.0.2, that illustrates effect of these hardware offloads.
Latency sensitive use-cases, like routing, will benefit from fewer NUMA nodes and disabled HT. High-throughput tasks do better with more cores, and will benefit from Hyper-Threading (unless they are cache-bound), and generally won’t care about NUMA too much.
Specifically, if you go the Intel path, you are looking for at least Haswell/Broadwell and ideally Skylake CPUs. If you are going with AMD, EPYC has quite impressive performance.
NIC
Here you are looking for at least 10G, preferably even 25G. If you want to push more than that through a single server over TLS, the tuning described here will not be sufficient, and you may need to push TLS framing down to the kernel level (e.g. FreeBSD, Linux).
On the software side, you should look for open source drivers with active mailing lists and user communities. This will be very important if (but most likely, when) you’ll be debugging driver-related problems.
Memory
The rule of thumb here is that latency-sensitive tasks need faster memory, while throughput-sensitive tasks need more memory.
Hard Drive
It depends on your buffering/caching requirements, but if you are going to buffer or cache a lot you should go for flash-based storage. Some go as far as using a specialized flash-friendly filesystem (usually log-structured), but they do not always perform better than plain ext4/xfs.
Anyway just be careful to not burn through your flash because you forgot to turn enable TRIM, or update the firmware.
Operating systems: Low level
Firmware
You should keep your firmware up-to-date to avoid painful and lengthy troubleshooting sessions. Try to stay recent with CPU Microcode, Motherboard, NICs, and SSDs firmwares. That does not mean you should always run bleeding edge—the rule of thumb here is to run the second to the latest firmware, unless it has critical bugs fixed in the latest version, but not run too far behind.
Drivers
The update rules here are pretty much the same as for firmware. Try staying close to current. One caveat here is to try to decoupling kernel upgrades from driver updates if possible. For example you can pack your drivers with DKMS, or pre-compile drivers for all the kernel versions you use. That way when you update the kernel and something does not work as expected there is one less thing to troubleshoot.
CPU
Your best friend here is the kernel repo and tools that come with it. In Ubuntu/Debian you can install the linux-tools package, with handful of utils, but now we only use cpupower, turbostat, and x86_energy_perf_policy. To verify CPU-related optimizations you can stress-test your software with your favorite load-generating tool (for example, Yandex uses Yandex.Tank.) Here is a presentation from the last NginxConf from developers about nginx loadtesting best-practices: “ NGINX Performance testing.”
cpupower
Using this tool is way easier than crawling /proc/. To see info about your processor and its frequency governor you should run:
$ cpupower frequency-info
...
  driver: intel_pstate
  ...
  available cpufreq governors: performance powersave
  ...
  The governor "performance" may decide which speed to use
  ...
  boost state support:
    Supported: yes
    Active: yes
Check that Turbo Boost is enabled, and for Intel CPUs make sure that you are running with intel_pstate, not the acpi-cpufreq, or even pcc-cpufreq. If you still using acpi-cpufreq, then you should upgrade the kernel, or if that’s not possible, make sure you are using performance governor. When running with intel_pstate, even powersave governor should perform well, but you need to verify it yourself.
And speaking about idling, to see what is really happening with your CPU, you can use turbostat to directly look into processor’s MSRs and fetch Power, Frequency, and Idle State information:
# turbostat --debug -P
... Avg_MHz Busy% ... CPU%c1 CPU%c3 CPU%c6 ... Pkg%pc2 Pkg%pc3 Pkg%pc6 .../proc/cpuinfo is lying to you), and core/package idle states. If even with the intel_pstate driver the CPU spends more time in idle than you think it should, you can: - Set governor to
performance. - Set
x86_energy_perf_policyto performance.
- Use
/dev/cpu_dma_latencyinterface. - For UDP traffic, use busy-polling.
CPU Affinity
You can additionally reduce latency by applying CPU affinity on each thread/process, e.g. nginx has worker_cpu_affinity directive, that can automatically bind each web server process to its own core. This should eliminate CPU migrations, reduce cache misses and pagefaults, and slightly increase instructions per cycle. All of this is verifiable through perf stat.
Sadly, enabling affinity can also negatively affect performance by increasing the amount of time a process spends waiting for a free CPU. This can be monitored by running runqlat on one of your nginx worker's PIDs:
usecs               : count     distribution
    0 -> 1          : 819      |                                        |
    2 -> 3          : 58888    |******************************          |
    4 -> 7          : 77984    |****************************************|
    8 -> 15         : 10529    |*****                                   |
   16 -> 31         : 4853     |**                                      |
   ...
 4096 -> 8191       : 34       |                                        |
 8192 -> 16383      : 39       |                                        |
16384 -> 32767 : 17 | |nginx itself, and affinity will increase latency, instead of decreasing it.
Memory
All mm/ tunings are usually very workflow specific, there are only a handful of things to recommend:
- Set THP to
madviseand enable them only when you are sure they are beneficial, otherwise you may get a order of magnitude slowdown while aiming for 20% latency improvement. - Unless you are only utilizing only a single NUMA node you should set
vm.zone_reclaim_modeto 0.
NUMA
Modern CPUs are actually multiple separate CPU dies connected by very fast interconnect and sharing various resources, starting from L1 cache on the HT cores, through L3 cache within the package, to Memory and PCIe links within sockets. This is basically what NUMA is: multiple execution and storage units with a fast interconnect.
For the comprehensive overview of NUMA and its implications you can consult “ NUMA Deep Dive Series” by Frank Denneman.
But, long story short, you have a choice of:
- Ignoring it, by disabling it in BIOS or running your software under
numactl --interleave=all, you can get mediocre, but somewhat consistent performance. - Denying it, by using single node servers, just like Facebook does with OCP Yosemite platform.
- Embracing it, by optimizing CPU/memory placing in both user- and kernel-space.
Let’s talk about the third option, since there is not much optimization needed for the first two.
To utilize NUMA properly you need to treat each numa node as a separate server, for that you should first inspect the topology, which can be done with numactl --hardware:
$ numactl --hardware
available: 4 nodes (0-3)
node 0 cpus: 0 1 2 3 16 17 18 19
node 0 size: 32149 MB
node 1 cpus: 4 5 6 7 20 21 22 23
node 1 size: 32213 MB
node 2 cpus: 8 9 10 11 24 25 26 27
node 2 size: 0 MB
node 3 cpus: 12 13 14 15 28 29 30 31
node 3 size: 0 MB
node distances:
node   0   1   2   3
  0:  10  16  16  16
  1:  16  10  16  16
  2:  16  16  10  16
  3:  16  16  16  10
Things to look after:
- number of nodes.
- memory sizes for each node.
- number of CPUs for each node.
- distances between nodes.
This is a particularly bad example since it has 4 nodes as well as nodes without memory attached. It is impossible to treat each node here as a separate server without sacrificing half of the cores on the system.
We can verify that by using numastat:
$ numastat -n -c
                  Node 0   Node 1 Node 2 Node 3    Total
                -------- -------- ------ ------ --------
Numa_Hit        26833500 11885723      0      0 38719223
Numa_Miss          18672  8561876      0      0  8580548
Numa_Foreign     8561876    18672      0      0  8580548
Interleave_Hit    392066   553771      0      0   945836
Local_Node       8222745 11507968      0      0 19730712
Other_Node 18629427 8939632 0 0 27569060numastat to output per-node memory usage statistics in the /proc/meminfo format:
$ numastat -m -c
                 Node 0 Node 1 Node 2 Node 3 Total
                 ------ ------ ------ ------ -----
MemTotal          32150  32214      0      0 64363
MemFree             462   5793      0      0  6255
MemUsed           31688  26421      0      0 58109
Active            16021   8588      0      0 24608
Inactive          13436  16121      0      0 29557
Active(anon)       1193    970      0      0  2163
Inactive(anon)      121    108      0      0   229
Active(file)      14828   7618      0      0 22446
Inactive(file)    13315  16013      0      0 29327
...
FilePages         28498  23957      0      0 52454
Mapped              131    130      0      0   261
AnonPages           962    757      0      0  1718
Shmem               355    323      0      0   678
KernelStack 10 5 0 0 16$ numactl --hardware
available: 2 nodes (0-1)
node 0 cpus: 0 1 2 3 4 5 6 7 16 17 18 19 20 21 22 23
node 0 size: 46967 MB
node 1 cpus: 8 9 10 11 12 13 14 15 24 25 26 27 28 29 30 31
node 1 size: 48355 MBSince the nodes are mostly symmetrical we can bind an instance of our application to each NUMA node with numactl --cpunodebind=X --membind=X and then expose it on a different port, that way you can get better throughput by utilizing both nodes and better latency by preserving memory locality.
You can verify NUMA placement efficiency by latency of your memory operations, e.g. by using bcc’s funclatency to measure latency of the memory-heavy operation, e.g. memmove.
On the kernel side, you can observe efficiency by using perf stat and looking for corresponding memory and scheduler events:
# perf stat -e sched:sched_stick_numa,sched:sched_move_numa,sched:sched_swap_numa,migrate:mm_migrate_pages,minor-faults -p PID
...
                 1      sched:sched_stick_numa
                 3      sched:sched_move_numa
                41      sched:sched_swap_numa
             5,239      migrate:mm_migrate_pages
50,161 minor-faultsPCIe
Normally you do not need to go too deep into PCIe troubleshooting unless you have some kind of hardware malfunction. Therefore it’s usually worth spending minimal effort there by just creating “link width”, “link speed”, and possibly RxErr/ BadTLP alerts for your PCIe devices. This should save you troubleshooting hours because of broken hardware or failed PCIe negotiation. You can use lspci for that:
# lspci -s 0a:00.0 -vvv
...
LnkCap: Port #0, Speed 8GT/s, Width x8, ASPM L1, Exit Latency L0s <2us, L1 <16us
LnkSta: Speed 8GT/s, Width x8, TrErr- Train- SlotClk+ DLActive- BWMgmt- ABWMgmt-
...
Capabilities: [100 v2] Advanced Error Reporting
UESta:  DLP- SDES- TLP- FCP- CmpltTO- CmpltAbrt- ...
UEMsk:  DLP- SDES- TLP- FCP- CmpltTO- CmpltAbrt- ...
UESvrt: DLP+ SDES+ TLP- FCP+ CmpltTO- CmpltAbrt- ...
CESta:  RxErr- BadTLP- BadDLLP- Rollover- Timeout- NonFatalErr-
CEMsk:  RxErr- BadTLP- BadDLLP- Rollover- Timeout- NonFatalErr+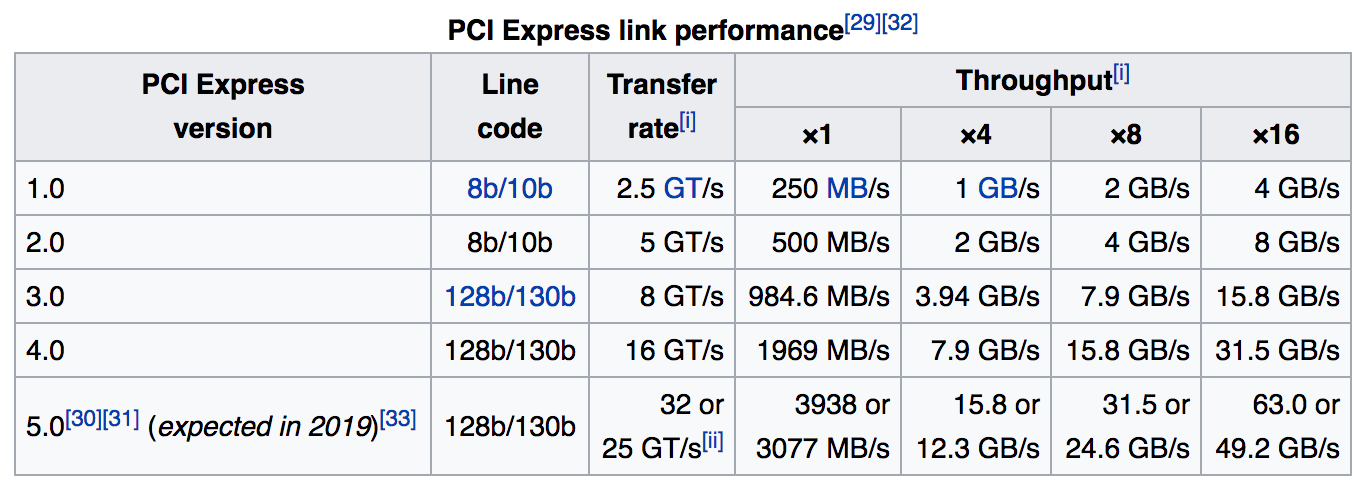
Also see the article, “ Understanding PCIe Configuration for Maximum Performance,” on the Mellanox website, that goes a bit deeper into PCIe configuration, which may be helpful at higher speeds if you observe packet loss between the card and the OS.
Intel suggests that sometimes PCIe power management (ASPM) may lead to higher latencies and therefore higher packet loss. You can disable it by adding pcie_aspm=off to the kernel cmdline.
NIC
Before we start, it worth mentioning that both Intel and Mellanox have their own performance tuning guides and regardless of the vendor you pick it’s beneficial to read both of them. Also drivers usually come with a README on their own and a set of useful utilities.
Next place to check for the guidelines is your operating system’s manuals, e.g. Red Hat Enterprise Linux Network Performance Tuning Guide, which explains most of the optimizations mentioned below and even more.
Cloudflare also has a good article about tuning that part of the network stack on their blog, though it is mostly aimed at low latency use-cases.
When optimizing NICs ethtool will be your best friend.
A small note here: if you are using a newer kernel (and you really should!) you should also bump some parts of your userland, e.g. for network operations you probably want newer versions of: ethtool, iproute2, and maybe iptables/ nftables packages.
Valuable insight into what is happening with you network card can be obtained via ethtool -S:
$ ethtool -S eth0 | egrep 'miss|over|drop|lost|fifo'
     rx_dropped: 0
     tx_dropped: 0
     port.rx_dropped: 0
     port.tx_dropped_link_down: 0
     port.rx_oversize: 0
     port.arq_overflows: 0
Consult with your NIC manufacturer for detailed stats description, e.g. Mellanox have a dedicated wiki page for them.
From the kernel side of things you’ll be looking at /proc/interrupts, /proc/softirqs, and /proc/net/softnet_stat. There are two useful bcc tools here: hardirqs and softirqs. Your goal in optimizing the network is to tune the system until you have minimal CPU usage while having no packet loss.
Interrupt Affinity
Tunings here usually start with spreading interrupts across the processors. How specifically you should do that depends on your workload:
- For maximum throughput you can distribute interrupts across all NUMA-nodes in the system.
- To minimize latency you can limit interrupts to a single NUMA-node. To do that you may need to reduce the number of queues to fit into a single node (this usually implies cutting their number in half with
ethtool -L).
Vendors usually provide scripts to do that, e.g. Intel has set_irq_affinity.
Ring buffer sizes
Network cards need to exchange information with the kernel. This is usually done through a data structure called a “ring”, current/maximum size of that ring viewed via ethtool -g:
$ ethtool -g eth0
Ring parameters for eth0:
Pre-set maximums:
RX:                4096
TX:                4096
Current hardware settings:
RX:                4096
TX:                4096
You can adjust these values within pre-set maximums with -G. Generally bigger is better here (esp. if you are using interrupt coalescing), since it will give you more protection against bursts and in-kernel hiccups, therefore reducing amount of dropped packets due to no buffer space/missed interrupt. But there are couple of caveats:
- On older kernels, or drivers without BQL support, high values may attribute to a higher bufferbloat on the tx-side.
- Bigger buffers will also increase cache pressure, so if you are experiencing one, try lowing them.
Coalescing
Interrupt coalescing allows you to delay notifying the kernel about new events by aggregating multiple events in a single interrupt. Current setting can be viewed via ethtool -c:
$ ethtool -c eth0
Coalesce parameters for eth0:
...
rx-usecs: 50
tx-usecs: 50
You can either go with static limits, hard-limiting maximum number of interrupts per second per core, or depend on the hardware to automatically adjust the interrupt rate based on the throughput.
Enabling coalescing (with -C) will increase latency and possibly introduce packet loss, so you may want to avoid it for latency sensitive. On the other hand, disabling it completely may lead to interrupt throttling and therefore limit your performance.
Offloads
Modern network cards are relatively smart and can offload a great deal of work to either hardware or emulate that offload in drivers themselves.
All possible offloads can be obtained with ethtool -k:
$ ethtool -k eth0
Features for eth0:
...
tcp-segmentation-offload: on
generic-segmentation-offload: on
generic-receive-offload: on
large-receive-offload: off [fixed]
In the output all non-tunable offloads are marked with [fixed] suffix.
There is a lot to say about all of them, but here are some rules of thumb:
- do not enable LRO, use GRO instead.
- be cautious about TSO, since it highly depends on the quality of your drivers/firmware.
- do not enable TSO/GSO on old kernels, since it may lead to excessive bufferbloat. **** Packet Steering All modern NICs are optimized for multi-core hardware, therefore they internally split packets into virtual queues, usually one-per CPU. When it is done in hardware it is called RSS, when the OS is responsible for loadbalancing packets across CPUs it is called RPS (with its TX-counterpart called XPS). When the OS also tries to be smart and route flows to the CPUs that are currently handling that socket, it is called RFS. When hardware does that it is called “Accelerated RFS” or aRFS for short.
Here are couple of best practices from our production:
- If you are using newer 25G+ hardware it probably has enough queues and a huge indirection table to be able to just RSS across all your cores. Some older NICs have limitations of only utilizing the first 16 CPUs.
- You can try enabling RPS if:
- you have more CPUs than hardware queues and you want to sacrifice latency for throughput.
- you are using internal tunneling (e.g. GRE/IPinIP) that NIC can’t RSS;
- Do not enable RPS if your CPU is quite old and does not have x2APIC.
- Binding each CPU to its own TX queue through XPS is generally a good idea.
- Effectiveness of RFS is highly depended on your workload and whether you apply CPU affinity to it.
Flow Director and ATR
Enabled flow director (or fdir in Intel terminology) operates by default in an Application Targeting Routing mode which implements aRFS by sampling packets and steering flows to the core where they presumably are being handled. Its stats are also accessible through ethtool -S:
$ ethtool -S eth0 | egrep 'fdir'
port.fdir_flush_cnt: 0
...
Though Intel claims that fdir increases performance in some cases, external research suggests that it can also introduce up to 1% of packet reordering, which can be quite damaging for TCP performance. Therefore try testing it for yourself and see if FD is useful for your workload, while keeping an eye for the TCPOFOQueue counter.
Operating systems: Networking stack
There are countless books, videos, and tutorials for the tuning the Linux networking stack. And sadly tons of “sysctl.conf cargo-culting” that comes with them. Even though recent kernel versions do not require as much tuning as they used to 10 years ago and most of the new TCP/IP features are enabled and well-tuned by default, people are still copy-pasting their old sysctls.conf that they’ve used to tune 2.6.18/2.6.32 kernels.
To verify effectiveness of network-related optimizations you should:
- Collect system-wide TCP metrics via
/proc/net/snmpand/proc/net/netstat. - Aggregate per-connection metrics obtained either from
ss -n --extended --info, or from callinggetsockopt(TCP_INFO)/getsockopt(TCP_CC_INFO)inside your webserver. - tcptrace(1)’es of sampled TCP flows.
- Analyze RUM metrics from the app/browser.
For sources of information about network optimizations, I usually enjoy conference talks by CDN-folks since they generally know what they are doing, e.g. Fastly on LinuxCon Australia. Listening what Linux kernel devs say about networking is quite enlightening too, for example netdevconf talks and NETCONF transcripts.
It worth highlighting good deep-dives into Linux networking stack by PackageCloud, especially since they put an accent on monitoring instead of blindly tuning things:
- Monitoring and Tuning the Linux Networking Stack: Receiving Data
- Monitoring and Tuning the Linux Networking Stack: Sending Data
Before we start, let me state it one more time: upgrade your kernel! There are tons of new network stack improvements, and I’m not even talking about IW10 ( which is so 2010). I am talking about new hotness like: TSO autosizing, FQ, pacing, TLP, and RACK, but more on that later. As a bonus by upgrading to a new kernel you’ll get a bunch of scalability improvements, e.g.: removed routing cache, lockless listen sockets, SO_REUSEPORT, and many more.
Overview
From the recent Linux networking papers the one that stands out is “ Making Linux TCP Fast.” It manages to consolidate multiple years of Linux kernel improvements on 4 pages by breaking down Linux sender-side TCP stack into functional pieces:
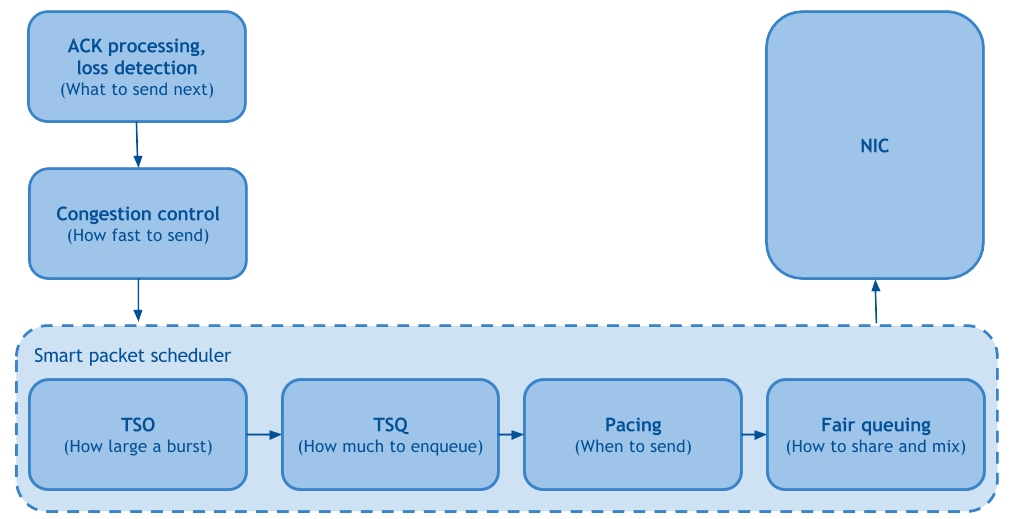
Fair Queueing and Pacing
Fair Queueing is responsible for improving fairness and reducing head of line blocking between TCP flows, which positively affects packet drop rates. Pacing schedules packets at rate set by congestion control equally spaced over time, which reduces packet loss even further, therefore increasing throughput.
As a side note: Fair Queueing and Pacing are available in linux via fq qdisc. Some of you may know that these are a requirement for BBR ( not anymore though), but both of them can be used with CUBIC, yielding up to 15-20% reduction in packet loss and therefore better throughput on loss-based CCs. Just don’t use it in older kernels (< 3.19), since you will end up pacing pure ACKs and cripple your uploads/RPCs.
TSO autosizing and TSQ
Both of these are responsible for limiting buffering inside the TCP stack and hence reducing latency, without sacrificing throughput.
Congestion Control
CC algorithms are a huge subject by itself, and there was a lot of activity around them in recent years. Some of that activity was codified as: tcp_cdg ( CAIA), tcp_nv (Facebook), and tcp_bbr (Google). We won’t go too deep into discussing their inner-workings, let’s just say that all of them rely more on delay increases than packet drops for a congestion indication.
BBR is arguably the most well-documented, tested, and practical out of all new congestion controls. The basic idea is to create a model of the network path based on packet delivery rate and then execute control loops to maximize bandwidth while minimizing rtt. This is exactly what we are looking for in our proxy stack.
Preliminary data from BBR experiments on our Edge PoPs shows an increase of file download speeds:
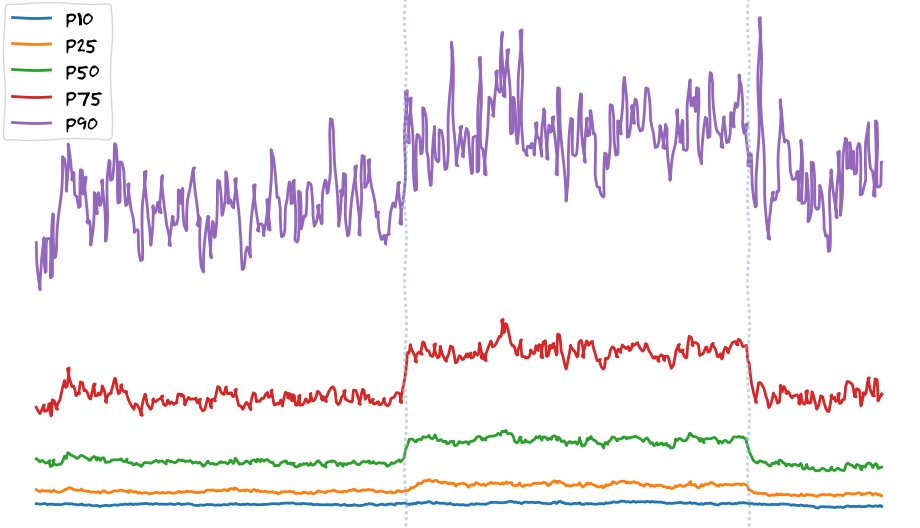
Here I want to stress out that we observe speed increase across all percentiles. That is not the case for backend changes. These usually only benefit p90+ users (the ones with the fastest internet connectivity), since we consider everyone else being bandwidth-limited already. Network-level tunings like changing congestion control or enabling FQ/pacing show that users are not being bandwidth-limited but, if I can say this, they are “TCP-limited.”
If you want to know more about BBR, APNIC has a good entry-level overview of BBR (and its comparison to loss-based congestions controls). For more in-depth information on BBR you probably want to read through bbr-dev mailing list archives (it has a ton of useful links pinned at the top). For people interested in congestion control in general it may be fun to follow Internet Congestion Control Research Group activity.
ACK Processing and Loss Detection
But enough about congestion control, let’s talk about let’s talk about loss detection, here once again running the latest kernel will help quite a bit. New heuristics like TLP and RACK are constantly being added to TCP, while the old stuff like FACK and ER is being retired. Once added, they are enabled by default so you do not need to tune any system settings after the upgrade.
Userspace prioritization and HOL
Userspace socket APIs provide implicit buffering and no way to re-order chunks once they are sent, therefore in multiplexed scenarios (e.g. HTTP/2) this may result in a HOL blocking, and inversion of h2 priorities. TCP_NOTSENT_LOWAT socket option (and corresponding net.ipv4.tcp_notsent_lowat sysctl) were designed to solve this problem by setting a threshold at which the socket considers itself writable (i.e. epoll will lie to your app). This can solve problems with HTTP/2 prioritization, but it can also potentially negatively affect throughput, so you know the drill—test it yourself.
Sysctls
One does not simply give a networking optimization talk without mentioning sysctls that need to be tuned. But let me first start with the stuff you don’t want to touch:
net.ipv4.tcp_tw_recycle=1—don’t use it—it was already broken for users behind NAT, but if you upgrade your kernel, it will be broken for everyone.net.ipv4.tcp_timestamps=0—don’t disable them unless you know all side-effects and you are OK with them. For example, one of non-obvious side effects is that you will loose window scaling and SACK options on syncookies.
As for sysctls that you should be using:
net.ipv4.tcp_slow_start_after_idle=0—the main problem with slowstart after idle is that “idle” is defined as one RTO, which is too small.net.ipv4.tcp_mtu_probing=1—useful if there are ICMP blackholes between you and your clients (most likely there are).net.ipv4.tcp_rmem,net.ipv4.tcp_wmem—should be tuned to fit BDP, just don’t forget that bigger isn’t always better.echo 2 > /sys/module/tcp_cubic/parameters/hystart_detect—if you are using fq+cubic, this might help with tcp_cubic exiting the slow-start too early.
It also worth noting that there is an RFC draft (though a bit inactive) from the author of curl, Daniel Stenberg, named TCP Tuning for HTTP, that tries to aggregate all system tunings that may be beneficial to HTTP in a single place.
Application level: Midlevel
Tooling
Just like with the kernel, having up-to-date userspace is very important. You should start with upgrading your tools, for example you can package newer versions of perf, bcc, etc.
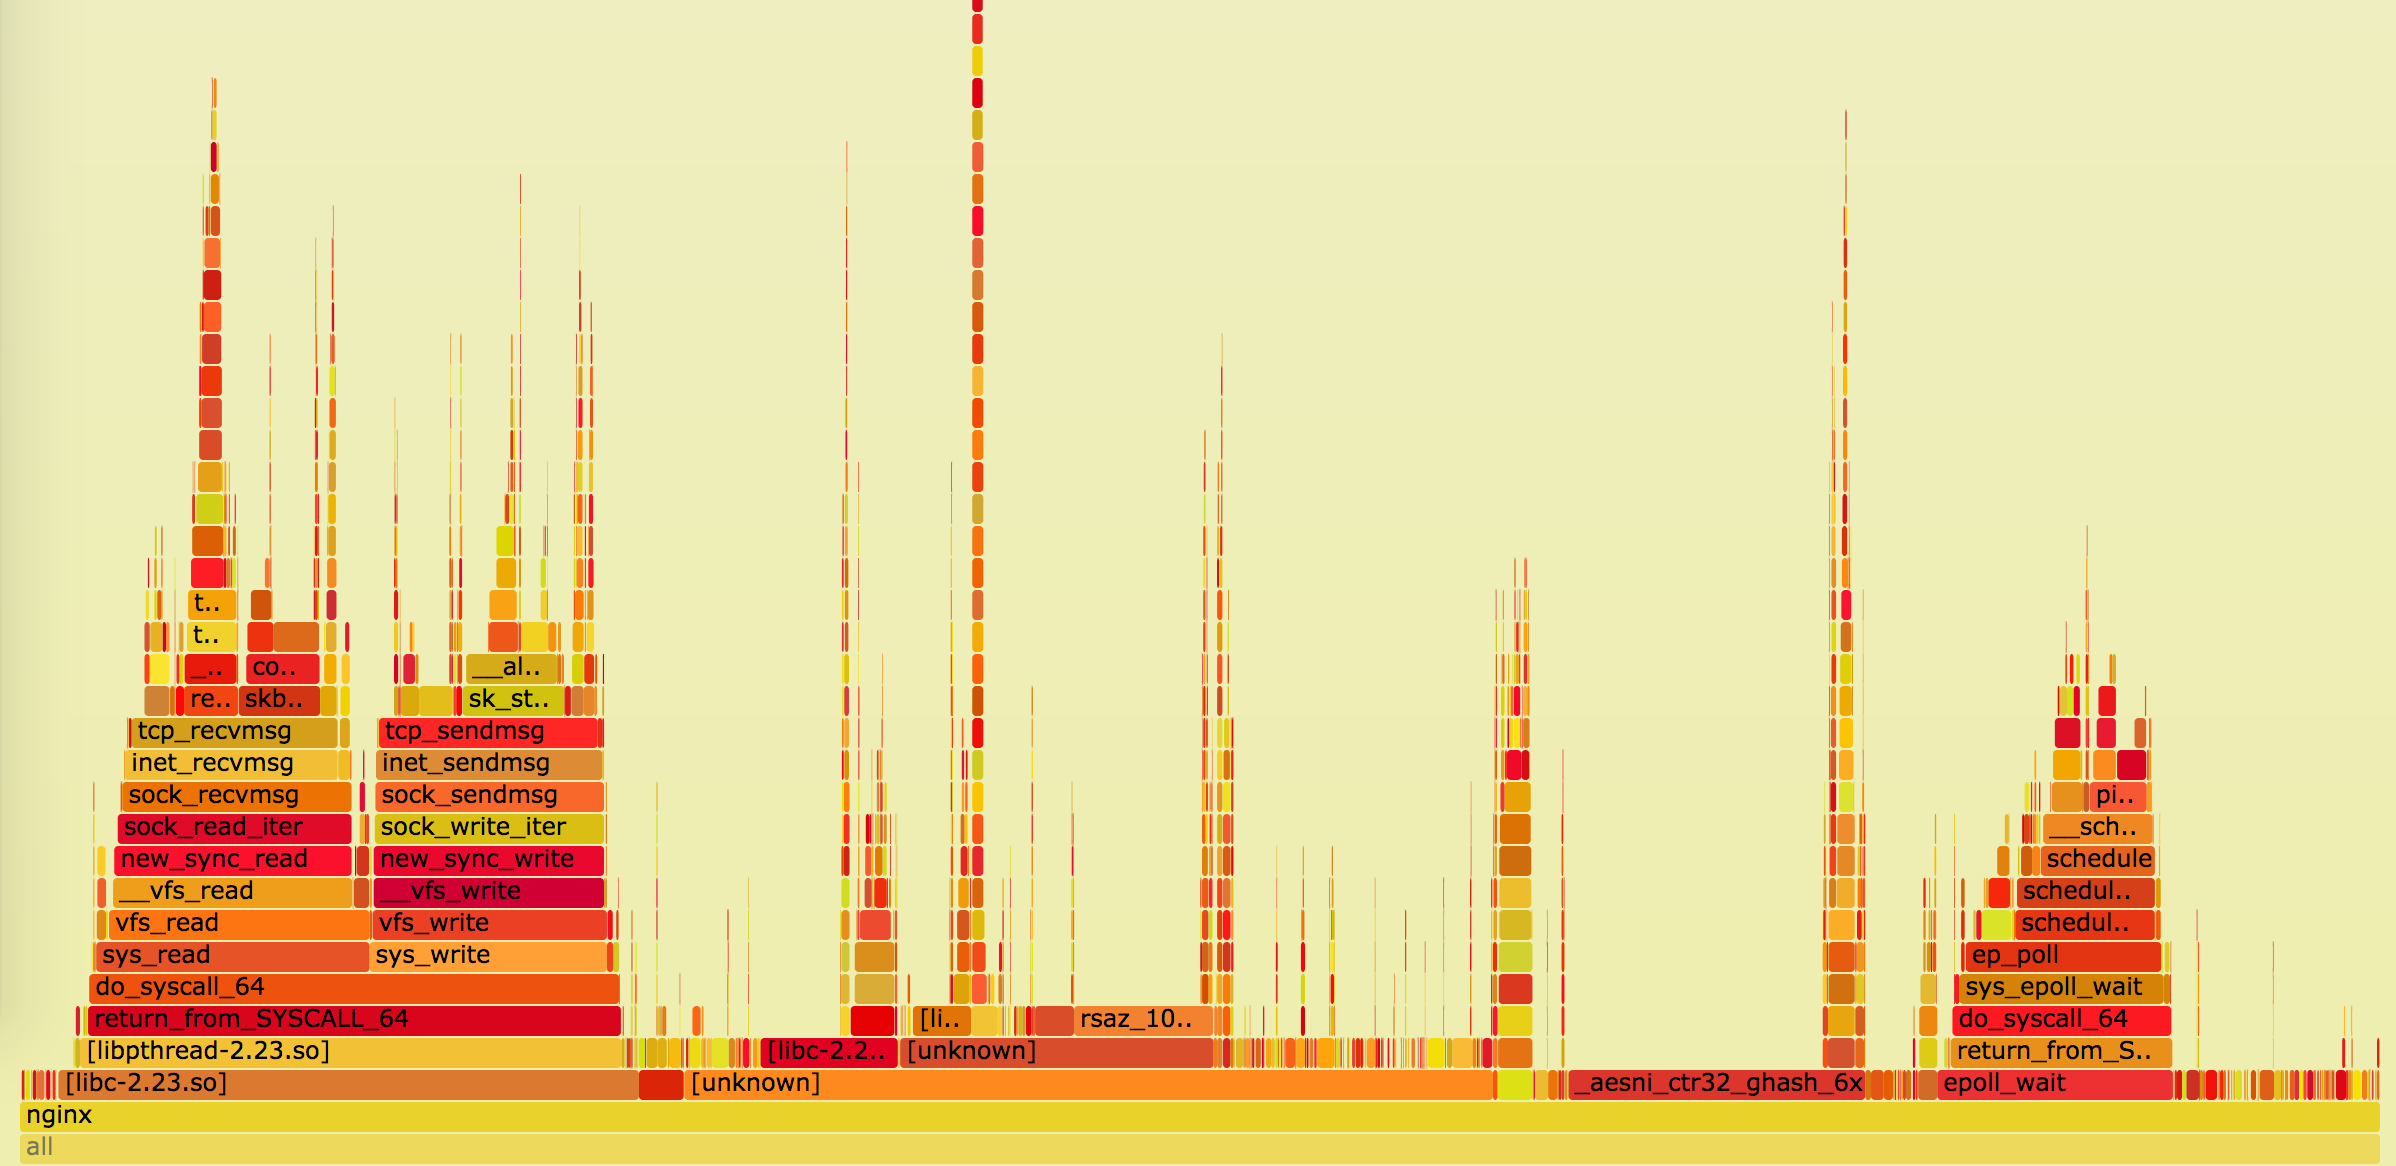
Once you have new tooling you are ready to properly tune and observe the behavior of a system. Through out this part of the post we’ll be mostly relying on on-cpu profiling with perf top, on-CPU flamegraphs, and adhoc histograms from bcc’s funclatency.
Compiler Toolchain
Having a modern compiler toolchain is essential if you want to compile hardware-optimized assembly, which is present in many libraries commonly used by web servers.
Aside from the performance, newer compilers have new security features (e.g. -fstack-protector-strong or SafeStack) that you want to be applied on the edge. The other use case for modern toolchains is when you want to run your test harnesses against binaries compiled with sanitizers (e.g. AddressSanitizer, and friends).
System libraries
It’s also worth upgrading system libraries, like glibc, since otherwise you may be missing out on recent optimizations in low-level functions from -lc, -lm, -lrt, etc. Test-it-yourself warning also applies here, since occasional regressions creep in.
Zlib
Normally web server would be responsible for compression. Depending on how much data is going though that proxy, you may occasionally see zlib’s symbols in perf top, e.g.:
# perf top
...
   8.88%  nginx        [.] longest_match
   8.29%  nginx        [.] deflate_slow
1.90% nginx [.] compress_blockMalloc
We’ve been mostly CPU-oriented when discussing optimizations up until now, but let’s switch gears and discuss memory-related optimizations. If you use lots of Lua with FFI or heavy third party modules that do their own memory management, you may observe increased memory usage due to fragmentation. You can try solving that problem by switching to either jemalloc or tcmalloc.
Using custom malloc also has the following benefits:
- Separating your nginx binary from the environment, so that glibc version upgrades and OS migration will affect it less.
- Better introspection, profiling and stats.
PCRE
If you use many complex regular expressions in your nginx configs or heavily rely on Lua, you may see pcre-related symbols in perf top. You can optimize that by compiling PCRE with JIT, and also enabling it in nginx via pcre_jit on;.
You can check the result of optimization by either looking at flame graphs, or using funclatency:
# funclatency /srv/nginx-bazel/sbin/nginx:ngx_http_regex_exec -u
...
     usecs               : count     distribution
         0 -> 1          : 1159     |**********                              |
         2 -> 3          : 4468     |****************************************|
         4 -> 7          : 622      |*****                                   |
         8 -> 15         : 610      |*****                                   |
        16 -> 31         : 209      |*                                       |
        32 -> 63         : 91       |                                        |
TLS
If you are terminating TLS on the edge w/o being fronted by a CDN, then TLS performance optimizations may be highly valuable. When discussing tunings we’ll be mostly focusing server-side efficiency.
So, nowadays first thing you need to decide is which TLS library to use: Vanilla OpenSSL, OpenBSD’s LibreSSL, or Google’s BoringSSL. After picking the TLS library flavor, you need to properly build it: OpenSSL for example has a bunch of built-time heuristics that enable optimizations based on build environment; BoringSSL has deterministic builds, but sadly is way more conservative and just disables some optimizations by default. Anyway, here is where choosing a modern CPU should finally pay off: most TLS libraries can utilize everything from AES-NI and SSE to ADX and AVX512. You can use built-in performance tests that come with your TLS library, e.g. in BoringSSL case it’s the bssl speed.
Most of performance comes not from the hardware you have, but from cipher-suites you are going to use, so you have to optimize them carefully. Also know that changes here can (and will!) affect security of your web server—the fastest ciphersuites are not necessarily the best. If unsure what encryption settings to use, Mozilla SSL Configuration Generator is a good place to start.
Asymmetric Encryption
If your service is on the edge, then you may observe a considerable amount of TLS handshakes and therefore have a good chunk of your CPU consumed by the asymmetric crypto, making it an obvious target for optimizations.
To optimize server-side CPU usage you can switch to ECDSA certs, which are generally 10x faster than RSA. Also they are considerably smaller, so it may speedup handshake in presence of packet-loss. But ECDSA is also heavily dependent on the quality of your system’s random number generator, so if you are using OpenSSL, be sure to have enough entropy (with BoringSSL you do not need to worry about that).
As a side note, it worth mentioning that bigger is not always better, e.g. using 4096 RSA certs will degrade your performance by 10x:
$ bssl speed
Did 1517 RSA 2048 signing ... (1507.3 ops/sec)
Did 160 RSA 4096 signing ... (153.4 ops/sec)$ bssl speed
Did 7056 ECDSA P-224 signing ... (6831.1 ops/sec)
Did 17000 ECDSA P-256 signing ... (16885.3 ops/sec)The rule of thumb here is that the most commonly used encryption is generally the most optimized one.
When running properly optimized OpenTLS-based library using RSA certs, you should see the following traces in your perf top: AVX2-capable, but not ADX-capable boxes (e.g. Haswell) should use AVX2 codepath:
  6.42%  nginx                [.] rsaz_1024_sqr_avx2
1.61% nginx [.] rsaz_1024_mul_avx2 7.08% nginx [.] sqrx8x_internal
2.30% nginx [.] mulx4x_internalperf top:
8.47% nginx [.] aesni_ctr32_ghash_6xBut it’s not only your servers that will need to deal with encryption/decryption—your clients will share the same burden on a way less capable CPU. Without hardware acceleration this may be quite challenging, therefore you may consider using an algorithm that was designed to be fast without hardware acceleration, e.g. ChaCha20-Poly1305. This will reduce TTLB for some of your mobile clients.
ChaCha20-Poly1305 is supported in BoringSSL out of the box, for OpenSSL 1.0.2 you may consider using Cloudflare patches. BoringSSL also supports “ equal preference cipher groups,” so you may use the following config to let clients decide what ciphers to use based on their hardware capabilities (shamelessly stolen from cloudflare/sslconfig):
ssl_ciphers '[ECDHE-ECDSA-AES128-GCM-SHA256|ECDHE-ECDSA-CHACHA20-POLY1305|ECDHE-RSA-AES128-GCM-SHA256|ECDHE-RSA-CHACHA20-POLY1305]:ECDHE+AES128:RSA+AES128:ECDHE+AES256:RSA+AES256:ECDHE+3DES:RSA+3DES';
ssl_prefer_server_ciphers on;
Application level: Highlevel
To analyze effectiveness of your optimizations on that level you will need to collect RUM data. In browsers you can use Navigation Timing APIs and Resource Timing APIs. Your main metrics are TTFB and TTV/TTI. Having that data in an easily queriable and graphable formats will greatly simplify iteration.
Compression
Compression in nginx starts with mime.types file, which defines default correspondence between file extension and response MIME type. Then you need to define what types you want to pass to your compressor with e.g. gzip_types. If you want the complete list you can use mime-db to autogenerate your mime.types and to add those with .compressible == true to gzip_types.
When enabling gzip, be careful about two aspects of it:
- Increased memory usage. This can be solved by limiting
gzip_buffers. - Increased TTFB due to the buffering. This can be solved by using
[gzip_no_buffer].
As a side note, http compression is not limited to gzip exclusively: nginx has a third party ngx_brotli module that can improve compression ratio by up to 30% compared to gzip.
As for compression settings themselves, let’s discuss two separate use-cases: static and dynamic data.
- For static data you can archive maximum compression ratios by pre-compressing your static assets as a part of the build process. We discussed that in quite a detail in the Deploying Brotli for static content post for both gzip and brotli.
- For dynamic data you need to carefully balance a full roundtrip: time to compress the data + time to transfer it + time to decompress on the client. Therefore setting the highest possible compression level may be unwise, not only from CPU usage perspective, but also from TTFB.
Buffering
Buffering inside the proxy can greatly affect web server performance, especially with respect to latency. The nginx proxy module has various buffering knobs that are togglable on a per-location basis, each of them is useful for its own purpose. You can separately control buffering in both directions via proxy_request_buffering and proxy_buffering. If buffering is enabled the upper limit on memory consumption is set by client_body_buffer_size and proxy_buffers, after hitting these thresholds request/response is buffered to disk. For responses this can be disabled by setting proxy_max_temp_file_size to 0.
Most common approaches to buffering are:
- Buffer request/response up to some threshold in memory and then overflow to disk. If request buffering is enabled, you only send a request to the backend once it is fully received, and with response buffering, you can instantaneously free a backend thread once it is ready with the response. This approach has the benefits of improved throughput and backend protection at the cost of increased latency and memory/io usage (though if you use SSDs that may not be much of a problem).
- No buffering. Buffering may not be a good choice for latency sensitive routes, especially ones that use streaming. For them you may want to disable it, but now your backend needs to deal with slow clients (incl. malicious slow-POST/slow-read kind of attacks).
- Application-controlled response buffering through the
X-Accel-Bufferingheader.
Whatever path you choose, do not forget to test its effect on both TTFB and TTLB. Also, as mentioned before, buffering can affect IO usage and even backend utilization, so keep an eye out for that too.
TLS
Now we are going to talk about high-level aspects of TLS and latency improvements that could be done by properly configuring nginx. Most of the optimizations I’ll be mentioning are covered in the High Performance Browser Networking’s “ Optimizing for TLS” section and Making HTTPS Fast(er) talk at nginx.conf 2014. Tunings mentioned in this part will affect both performance and security of your web server, if unsure, please consult with Mozilla’s Server Side TLS Guide and/or your Security Team.
To verify the results of optimizations you can use:
- WebpageTest for impact on performance.
- SSL Server Test from Qualys, or Mozilla TLS Observatory for impact on security.
Session resumption
As DBAs love to say “the fastest query is the one you never make.” The same goes for TLS—you can reduce latency by one RTT if you cache the result of the handshake. There are two ways of doing that:
- You can ask the client to store all session parameters (in a signed and encrypted way), and send it to you during the next handshake (similar to a cookie). On the nginx side this is configured via the
ssl_session_ticketsdirective. This does not not consume any memory on the server-side but has a number of downsides:- You need the infrastructure to create, rotate, and distribute random encryption/signing keys for your TLS sessions. Just remember that you really shouldn’t 1) use source control to store ticket keys 2) generate these keys from other non-ephemeral material e.g. date or cert.
- PFS won’t be on a per-session basis but on a per-tls-ticket-key basis, so if an attacker gets a hold of the ticket key, they can potentially decrypt any captured traffic for the duration of the ticket.
- Your encryption will be limited to the size of your ticket key. It does not make much sense to use AES256 if you are using 128-bit ticket key. Nginx supports both 128 bit and 256 bit TLS ticket keys.
- Not all clients support ticket keys (all modern browsers do support them though).
- Or you can store TLS session parameters on the server and only give a reference (an id) to the client. This is done via the
ssl_session_cachedirective. It has a benefit of preserving PFS between sessions and greatly limiting attack surface. Though ticket keys have downsides:- They consume ~256 bytes of memory per session on the server, which means you can’t store many of them for too long.
- They can not be easily shared between servers. Therefore you either need a loadbalancer which will send the same client to the same server to preserve cache locality, or write a distributed TLS session storage on top off something like
ngx_http_lua_module.
As a side note, if you go with session ticket approach, then it’s worth using 3 keys instead of one, e.g.:
ssl_session_tickets on;
ssl_session_timeout 1h;
ssl_session_ticket_key /run/nginx-ephemeral/nginx_session_ticket_curr;
ssl_session_ticket_key /run/nginx-ephemeral/nginx_session_ticket_prev;
ssl_session_ticket_key /run/nginx-ephemeral/nginx_session_ticket_next;
You will be always encrypting with the current key, but accepting sessions encrypted with both next and previous keys.
OCSP Stapling
You should staple your OCSP responses, since otherwise:
- Your TLS handshake may take longer because the client will need to contact the certificate authority to fetch OCSP status.
- On OCSP fetch failure may result in availability hit.
- You may compromise users’ privacy since their browser will contact a third party service indicating that they want to connect to your site.
To staple the OCSP response you can periodically fetch it from your certificate authority, distribute the result to your web servers, and use it with the ssl_stapling_file directive:
ssl_stapling_file /var/cache/nginx/ocsp/www.der;TLS record size
TLS breaks data into chunks called records, which you can’t verify and decrypt until you receive it in its entirety. You can measure this latency as the difference between TTFB from the network stack and application points of view.
By default nginx uses 16k chunks, which do not even fit into IW10 congestion window, therefore require an additional roundtrip. Out-of-the box nginx provides a way to set record sizes via ssl_buffer_size directive:
- To optimize for low latency you should set it to something small, e.g. 4k. Decreasing it further will be more expensive from a CPU usage perspective.
- To optimize for high throughput you should leave it at 16k.
There are two problems with static tuning:
- You need to tune it manually.
- You can only set
ssl_buffer_sizeon a per-nginx config or per-server block basis, therefore if you have a server with mixed latency/throughput workloads you’ll need to compromize.
There is an alternative approach: dynamic record size tuning. There is an nginx patch from Cloudflare that adds support for dynamic record sizes. It may be a pain to initially configure it, but once you over with it, it works quite nicely.
TLS 1.3
TLS 1.3 features indeed sound very nice, but unless you have resources to be troubleshooting TLS full-time I would suggest not enabling it, since:
- It is still a draft.
- 0-RTT handshake has some security implications. And your application needs to be ready for it.
- There are still middleboxes (antiviruses, DPIs, etc) that block unknown TLS versions.
Eventloop Stalls
Nginx is an eventloop-based web server, which means it can only do one thing at a time. Even though it seems that it does all of these things simultaneously, like in time-division multiplexing, all nginx does is just quickly switches between the events, handling one after another. It all works because handling each event takes only couple of microseconds. But if it starts taking too much time, e.g. because it requires going to a spinning disk, latency can skyrocket.
If you start noticing that your nginx are spending too much time inside the ngx_process_events_and_timers function, and distribution is bimodal, then you probably are affected by eventloop stalls.
# funclatency '/srv/nginx-bazel/sbin/nginx:ngx_process_events_and_timers' -m
     msecs               : count     distribution
         0 -> 1          : 3799     |****************************************|
         2 -> 3          : 0        |                                        |
         4 -> 7          : 0        |                                        |
         8 -> 15         : 0        |                                        |
        16 -> 31         : 409      |****                                    |
        32 -> 63         : 313      |***                                     |
        64 -> 127        : 128      |*                                       |
AIO and Threadpools
Since the main source of eventloop stalls especially on spinning disks is IO, you should probably look there first. You can measure how much you are affected by it by running fileslower:
# fileslower 10
Tracing sync read/writes slower than 10 ms
TIME(s)  COMM           TID    D BYTES   LAT(ms) FILENAME
2.642    nginx          69097  R 5242880   12.18 0002121812
4.760    nginx          69754  W 8192      42.08 0002121598
4.760    nginx          69435  W 2852      42.39 0002121845
4.760 nginx 69088 W 2852 41.83 0002121854aio threads;
aio_write on;For more complicated cases you can set up custom thread_pool's, e.g. one per-disk, so that if one drive becomes wonky, it won’t affect the rest of the requests. Thread pools can greatly reduce the number of nginx processes stuck in D state, improving both latency and throughput. But it won’t eliminate eventloop stalls fully, since not all IO operations are currently offloaded to it.
Logging Writing logs can also take a considerable amount of time, since it is hitting disks. You can check whether that’s that case by running ext4slower and looking for access/error log references:
# ext4slower 10
TIME     COMM           PID    T BYTES   OFF_KB   LAT(ms) FILENAME
06:26:03 nginx          69094  W 163070  634126     18.78 access.log
06:26:08 nginx          69094  W 151     126029     37.35 error.log
06:26:13 nginx          69082  W 153168  638728    159.96 access.log
It is possible to workaround this by spooling access logs in memory before writing them by using buffer parameter for the access_log directive. By using gzip parameter you can also compress the logs before writing them to disk, reducing IO pressure even more.
But to fully eliminate IO stalls on log writes you should just write logs via syslog, this way logs will be fully integrated with nginx eventloop.
Open file cache
Since open(2) calls are inherently blocking and web servers are routinely opening/reading/closing files it may be beneficial to have a cache of open files. You can see how much benefit there is by looking at ngx_open_cached_file function latency:
# funclatency /srv/nginx-bazel/sbin/nginx:ngx_open_cached_file -u
     usecs               : count     distribution
         0 -> 1          : 10219    |****************************************|
         2 -> 3          : 21       |                                        |
         4 -> 7          : 3        |                                        |
8 -> 15 : 1 | |open_file_cache max=10000;
open_file_cache_min_uses 2;
open_file_cache_errors on;open_file_cache you can observe all the cache misses by looking at opensnoop and deciding whether you need to tune the cache limits:
# opensnoop -n nginx
PID    COMM               FD ERR PATH
69435  nginx             311   0 /srv/site/assets/serviceworker.js
69086  nginx             158   0 /srv/site/error/404.html
...
Wrapping up
All optimizations that were described in this post are local to a single web server box. Some of them improve scalability and performance. Others are relevant if you want to serve requests with minimal latency or deliver bytes faster to the client. But in our experience a huge chunk of user-visible performance comes from a more high-level optimizations that affect behavior of the Dropbox Edge Network as a whole, like ingress/egress traffic engineering and smarter Internal Load Balancing. These problems are on the edge (pun intended) of knowledge, and the industry has only just started approaching them.
We’re hiring!
Do you like traffic-related stuff? Dropbox has a globally distributed edge network, terabits of traffic, millions of requests per second, and a small team in Mountain View, CA. The Traffic team is hiring both SWEs and SREs to work on TCP/IP packet processors and load balancers, HTTP/2 proxies, and our internal gRPC-based service mesh. Not your thing? We’re also hiring for a wide variety of engineering positions in San Francisco, New York, Seattle, Tel Aviv, and other offices around the world.


